Now that we have friends and family geographically placed in different locations, there arises situation where you need to help some one with an installation or configure some software in the PC. Previous ways of doing it included sending mails with detailed steps and snapshots to do the job or guiding them over phone while they perform the job. This however does not work all the time. I started searching for software that would let me remotely access PCs and control them and I came across Team Viewer.
The software is relatively easy to install and use. I had no problems in the installation or the usage. There is very minimal latency involved while you remotely access the PC. It has few nice features such as chat & file transfer.
The entire steps involved are explained here.
Other software that you can use are GotoMeeting, GotoMyPC. Teamviewer is totally free for non-commercial usage, which is good enough for us. There are trial versions available for GotoMeeting and GotoMyPC over a short period of time. Hope you guys find it useful !!
Friday, August 20, 2010
Friday, August 6, 2010
Googe Chart API
Recently I wanted to develop a tool that would show graphs on a web page. As I searched more and more, I began to understand that it was not easy as I though it would be.
I tried to display a bar chart using javascripts (cnxLABS). It worked fine, but then it was quite clumsy.
I stumbled upon JPGraph. These guys support so many different types of charts. Quite handy and easy to include it in your code. Rendering doesn't look sharp though.
PChart just looked cool on the site, but i was not able to include it in my project and run it. I just got too many errors. If any one out there was able to use it successfully in your project, please let me know :)
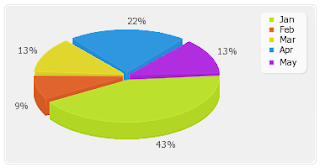
Finally, I decided to use Google Chart API. Simply awesome. Easy to include in your project and the rendering is just smooth and pleasing. The disadvantage, though, is you need to be connected to the internet to display charts in your web page. This will not be acceptable in certain cases. The Google Code Playground makes your easier in building charts. Most of the charts are interactive, which makes the experience better.
Happy Charting :)
I tried to display a bar chart using javascripts (cnxLABS). It worked fine, but then it was quite clumsy.
I stumbled upon JPGraph. These guys support so many different types of charts. Quite handy and easy to include it in your code. Rendering doesn't look sharp though.
PChart just looked cool on the site, but i was not able to include it in my project and run it. I just got too many errors. If any one out there was able to use it successfully in your project, please let me know :)
Finally, I decided to use Google Chart API. Simply awesome. Easy to include in your project and the rendering is just smooth and pleasing. The disadvantage, though, is you need to be connected to the internet to display charts in your web page. This will not be acceptable in certain cases. The Google Code Playground makes your easier in building charts. Most of the charts are interactive, which makes the experience better.
Sample code to display a pie chart
function drawVisualization()
{
// Create and populate the data table.
var data = new google.visualization.DataTable();
data.addColumn('string', 'Task');
data.addColumn('number', 'Hours per Day');
data.addRows(5);
data.setValue(0, 0, 'Work');
data.setValue(0, 1, 11);
data.setValue(1, 0, 'Eat');
data.setValue(1, 1, 2);
data.setValue(2, 0, 'Commute');
data.setValue(2, 1, 2);
data.setValue(3, 0, 'Watch TV');
data.setValue(3, 1, 2);
data.setValue(4, 0, 'Sleep');
data.setValue(4, 1, 7);
// Create and draw the visualization.
new google.visualization.PieChart(document.getElementById('visualization')).
draw(data, {title:"So, how was your day?"});
}
Happy Charting :)
Labels:
Programming,
Web
Subscribe to:
Posts (Atom)